Facebook
 X
 Pinterest
 Copy Link

When you’re deciding what to offer on a home or how to price one for sale, conflicting home price headlines can leave you unsure where to start. One report says prices are falling; another says they’re still rising. Both can be accurate, because they may describe different places, time periods, or types of prices.
The useful question is how those numbers relate to the homes you’re considering. A national trend can provide context, while recent sales nearby help you make a more informed decision for your move.
Why Home Price Headlines Can Seem Contradictory
An asking price is what a seller hopes to receive. A sale price is what a buyer actually pays. Headlines may also compare this month with last month, or with the same month a year earlier. Those comparisons don’t always move in the same direction.
A median is the middle price among the homes measured. It can fall when more lower-priced homes enter the mix, even without every property losing value. Repeat-sales indexes, like Case-Shiller, instead track price changes using sales of the same properties over time.
Why Asking Prices Ease in Fall
According to HousingWire data, the national median asking price fell from $449,000 on August 7 to $435,000 on October 9. That’s a $14,000 decline, or about 3% in two months.
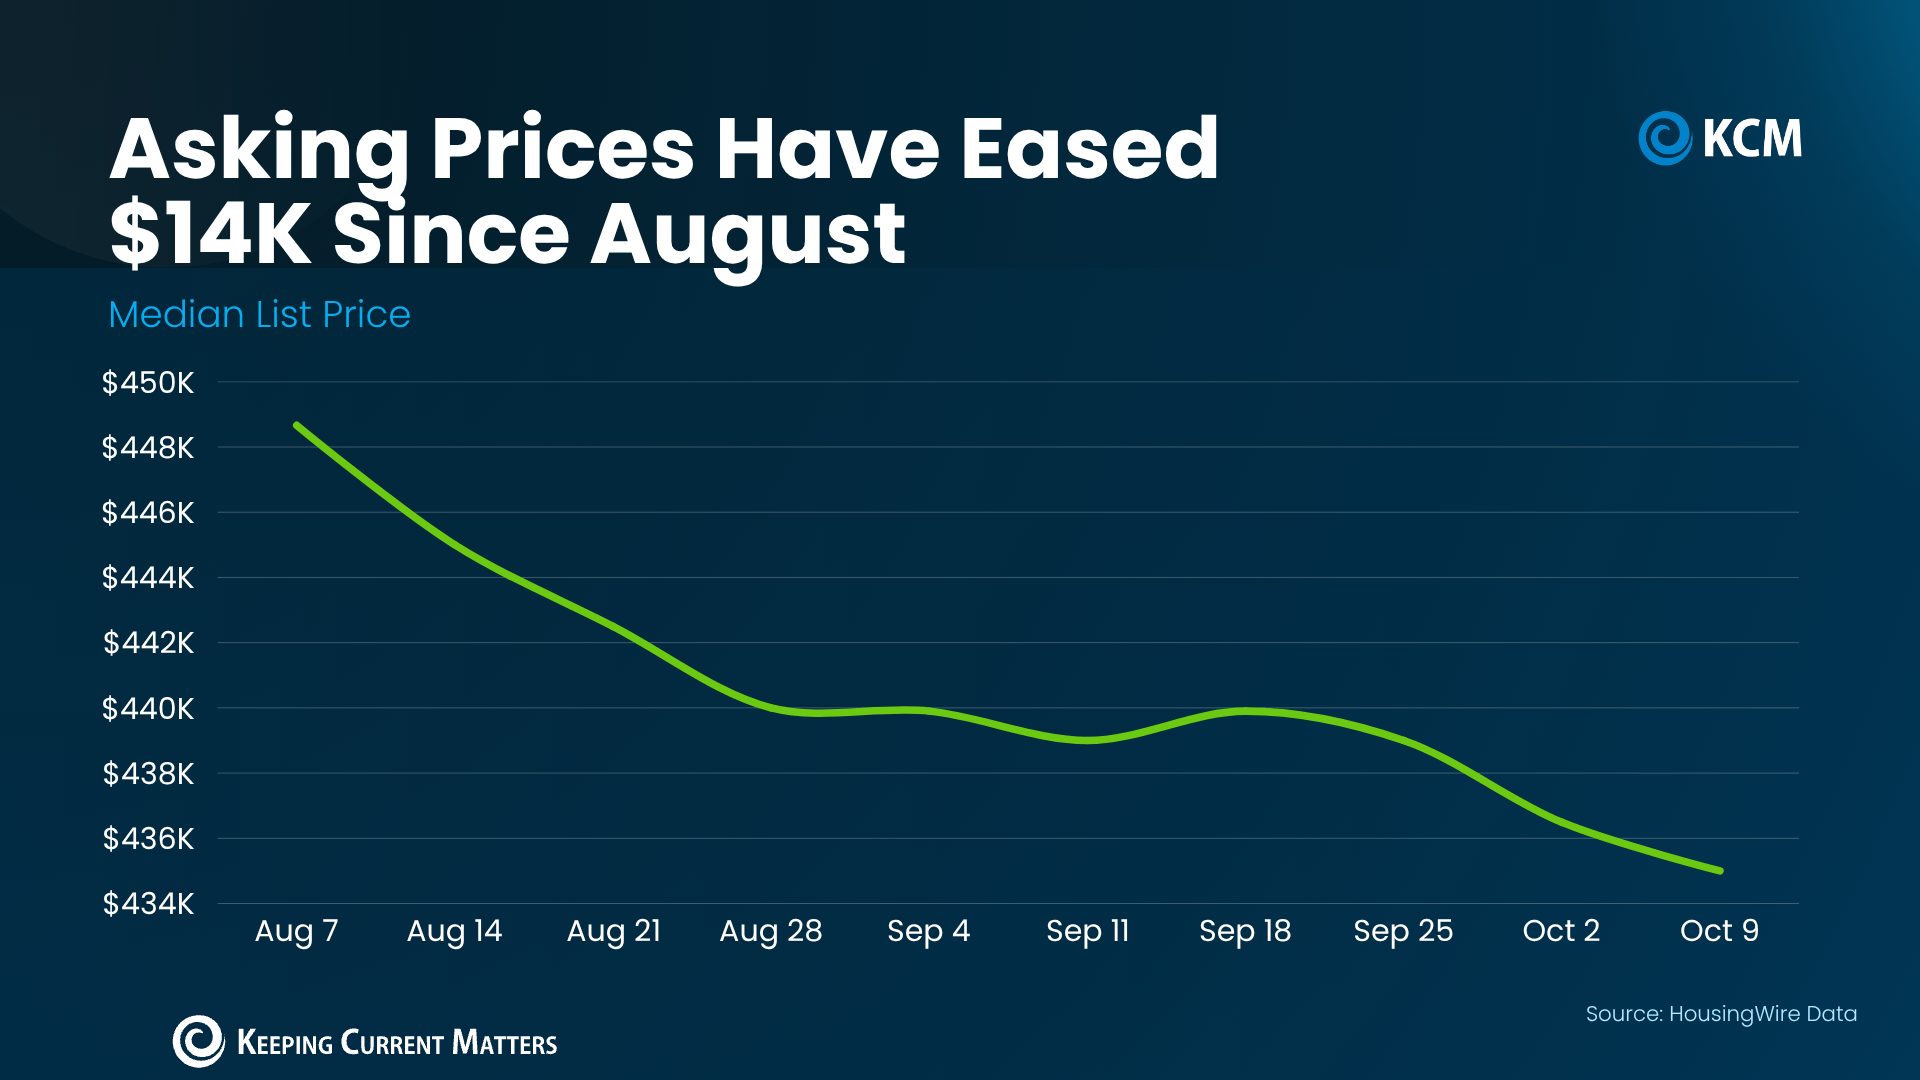
National median asking prices, August 7–October 9, 2026. Source: HousingWire.
Asking prices often soften after the busy summer season as buyer activity slows. Higher mortgage rates can add pressure by limiting what buyers can afford. Sellers often respond with more competitive pricing, but a lower list price alone doesn’t always guarantee a quicker sale.
There’s also more buyer choice. Realtor.com reported inventory at its highest level since November 2019 in the week ending August 29, 2026. Its September report described rising rates and weaker demand. Homes took slightly longer to sell than in August, though they still sold a day faster than last year.
How Local Home Prices Change the Picture
Location and property type matter just as much as the measure. As Realtor.com explains:
“While national headlines might suggest a buyer’s market is taking hold, the reality on the ground depends heavily on where and what you’re trying to buy. Local trends can diverge sharply from national averages, especially when you factor in price range, property type, and post-pandemic market dynamics.”
The July 2026 S&P Cotality Case-Shiller results, released September 29, illustrate that difference. Chicago prices rose about 6.9% from a year earlier, while Seattle fell about 1.6%, a gap of roughly 8.5 percentage points. New York gained about 5.8%; Denver and Las Vegas declined about 1.1% and 1.3%, respectively.
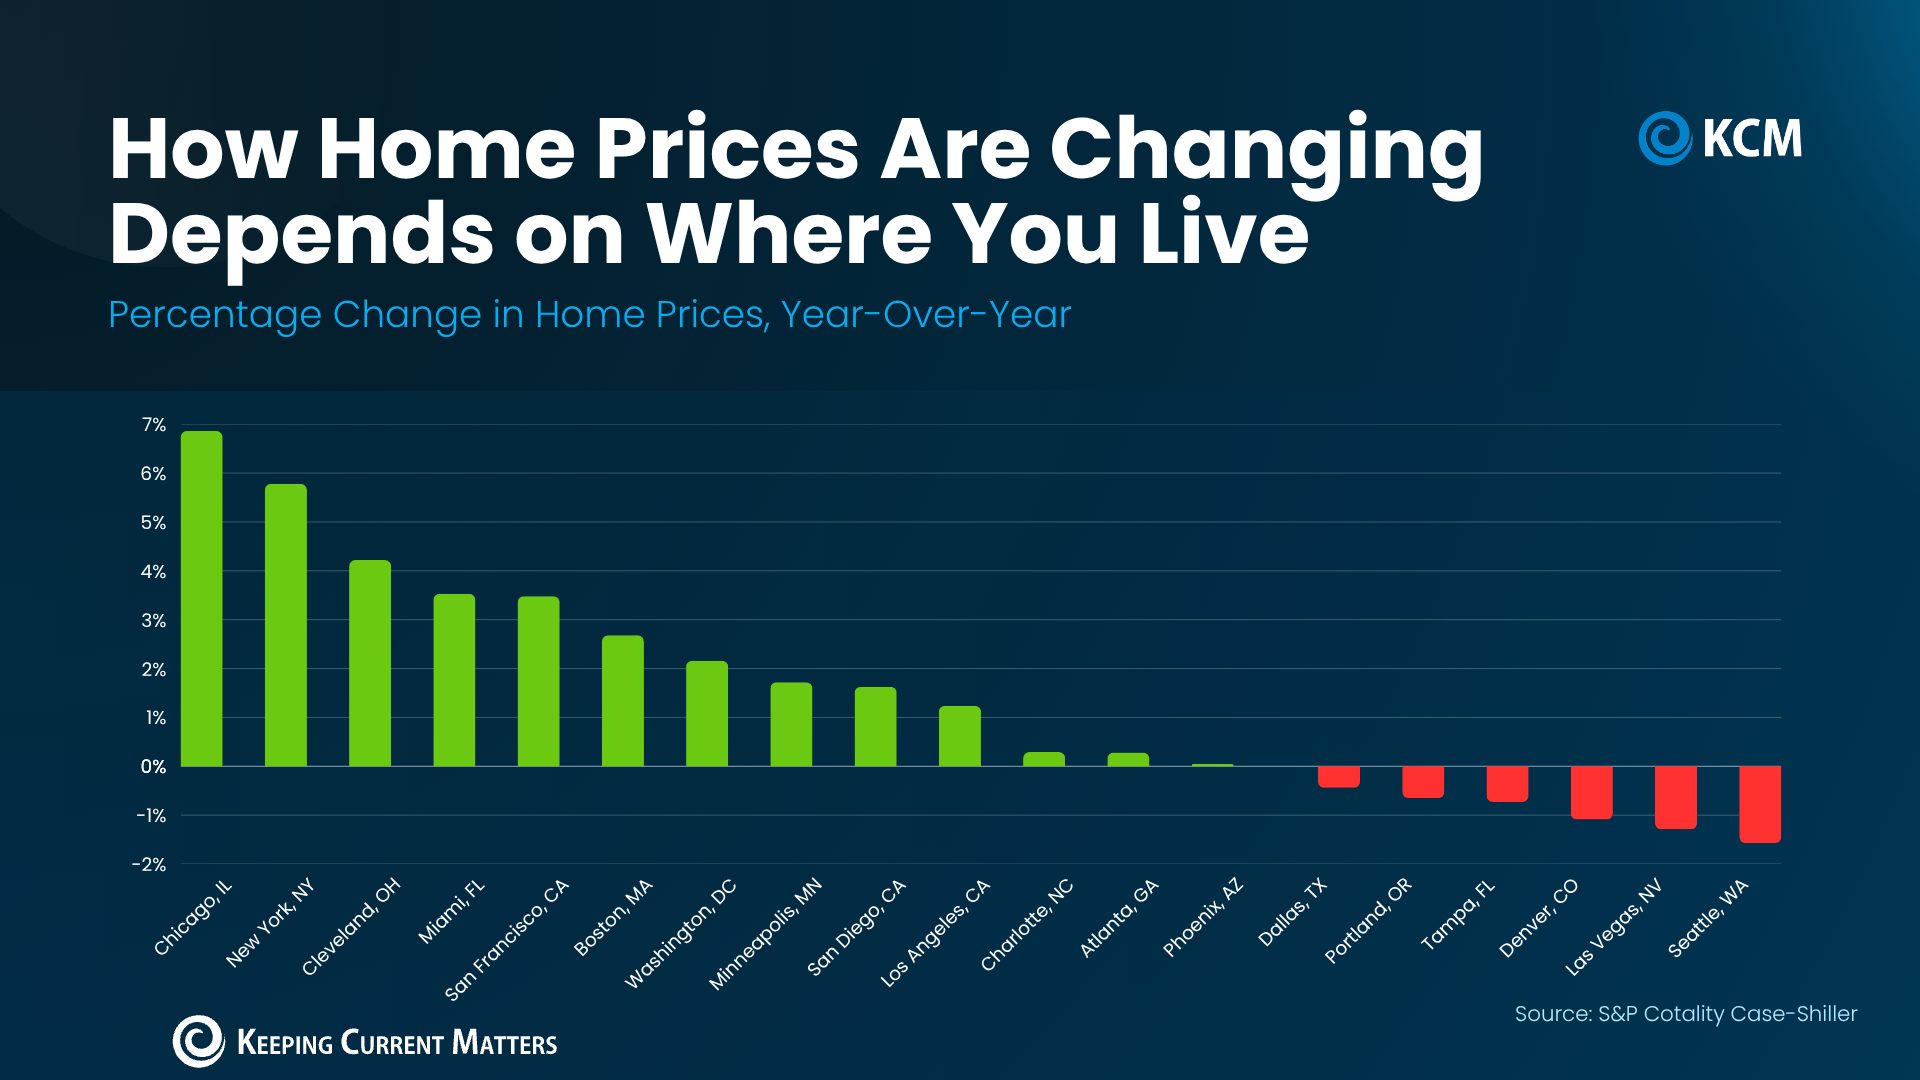
Annual price changes through July 2026 in 19 metropolitan areas. Detroit had no July update. Source: S&P Cotality Case-Shiller.
Those differences may affect negotiating room. A New York seller still needs a price supported by similar local sales, and a Denver or Las Vegas buyer still needs to assess any given listing by the market. Simply put, a trend for one metro area doesn’t necessarily apply to another.
What These Trends Say About a Housing Crash
Among the 19 metros with July updates in that Case-Shiller release, more rose than fell, and the declines were under 2%. That snapshot doesn’t indicate a broad collapse like the 2008 market crash. At the same time, it also can’t rule out future declines or tell you when a local dip will end.
Long Term Home Values Offer Perspective
FHFA reported annual national price growth in every quarter from early 2012 through the second quarter of 2026. Its cumulative increase since the first quarter of 1991 translates a hypothetical $100,000 starting value into about $436,000, including the 2008 crash.
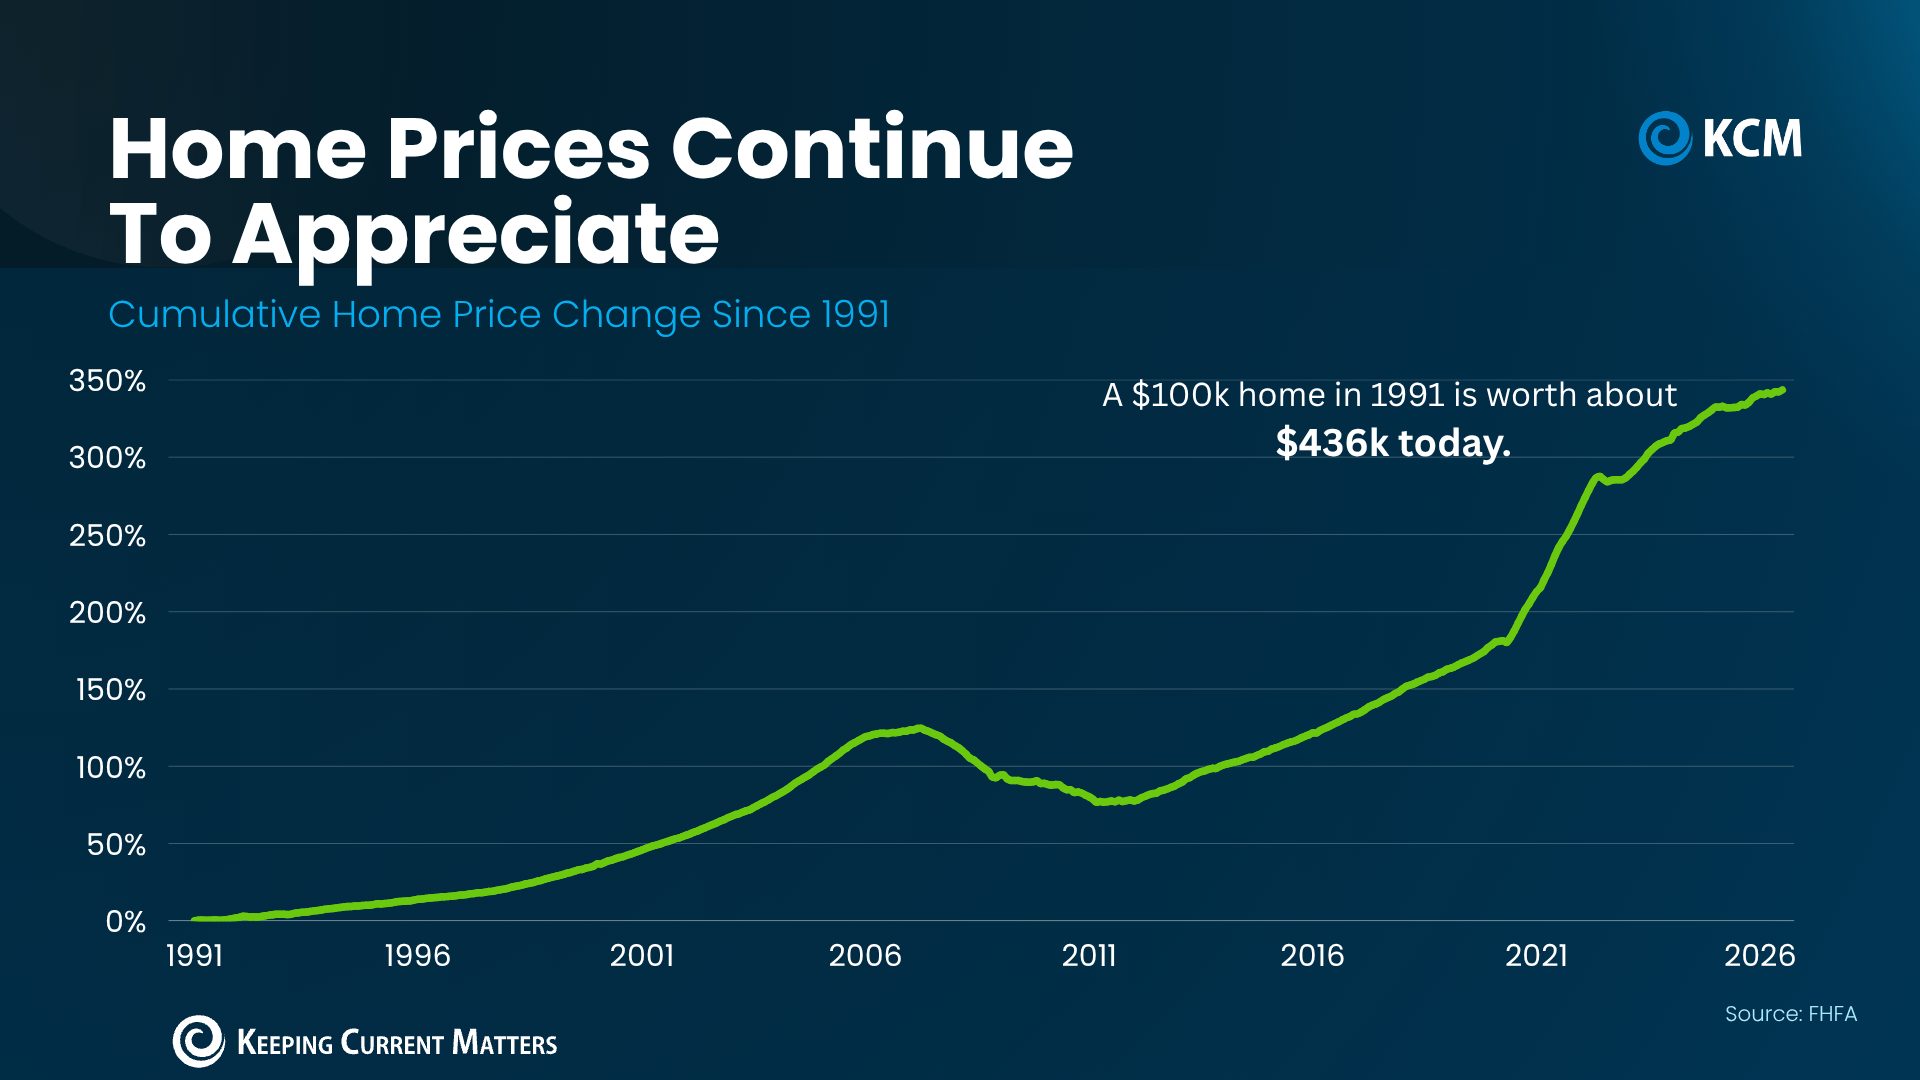
FHFA’s national purchase-only index rose 335.69% from Q1 1991 to Q2 2026, seasonally adjusted and before inflation.
That’s an illustration based on a national index, before inflation and ownership costs. Your own home’s value may follow a different path. Past appreciation doesn’t guarantee a return, and markets adjusting after rapid growth can take different amounts of time to recover.
Plan Your Move With Local Data
Before changing your plans, ask an agent to compare recent closed sales with competing listings in your price range. Review property condition, days on market, and price reductions together. For financing decisions, discuss your budget with a qualified lender.
Connect with a local CENTURY 21 Affiliated agent to understand what current home prices mean for your offer, listing price, or next move.